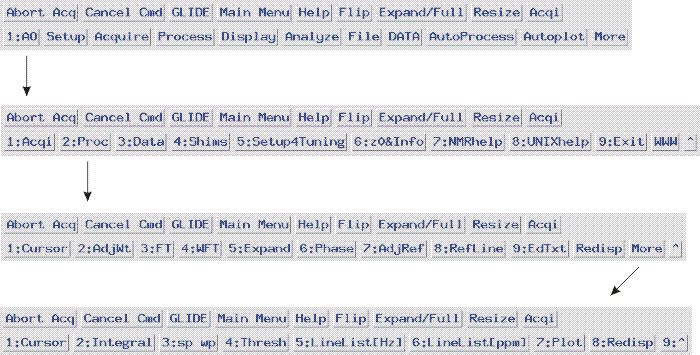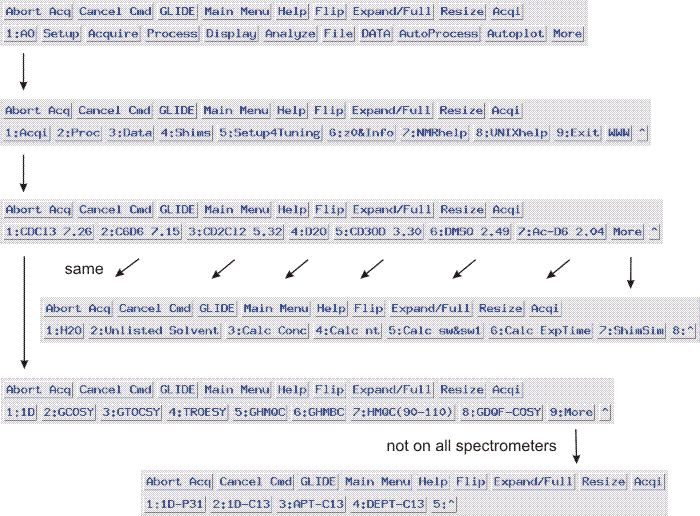
Figure 6.1: AO Acquisition menu buttons
6. Data acquisition using 1:AO menu system
|
VNMR
features (commands, macros, menus, etc.) are fully maintained. |
|
Menu buttons in the AO menu system show a
number which relates to the F-key
on top of the keyboard. Clicking the button with the mouse or hitting the
corresponding F-key on the keyboard has the same effect
but he F-keys are limited to F1 - F9. |
Staying within the AO menu
system does not require any commands to be typed. However, clicking
on AO menus and entering commands may
put you |
After logging in, you are in the experiment number last used before exiting VNMR. VNMR has 9 experiments by default (expandable by the user see NMR News 99-08).
Many common proton 1D and 2D experiments in D2O, CDCl3, CD3OD, CD2Cl2, C6D6, acetone-D6 and DMSO can be loaded by menu buttons as shown in the following Figure:
|
Figure 6.1: AO Acquisition menu buttons |
6.1 Example: recording of a 1D proton and GCOSY in C6D6
First always record a 1D spectrum. This allows to check if the sample is really worthwhile for a 2D (purity!), if the shimming is really what it should be and to make other adjustments if necessary.
6.1.1 1D spectrum (acquisition in experiment #1)
system requests and actions |
operator input |
1:AO -> 1:Acqi -> 2:C6D6 7.15 -> 1:1D |
|
| What is the molecular weight? | 372 |
| How many mg of the compound? | 18 |
| Sample concentration is 70 mM | |
| Based on concentration and spectrometer sensitivity, number of transients (nt) and experimental time are calculated for a 1D 1H | |
| Total acquisition time is 1.5 minutes | |
| Do you want to proceed [y] or [n]? | y |
| reads in the solvent- and spectrometer-specific parameter set and starts the acquisition | |
EXPERIMENT STARTED |
relax and wait |
1.5 minutes later: Acquisition complete |
|
waits for input (see below) |
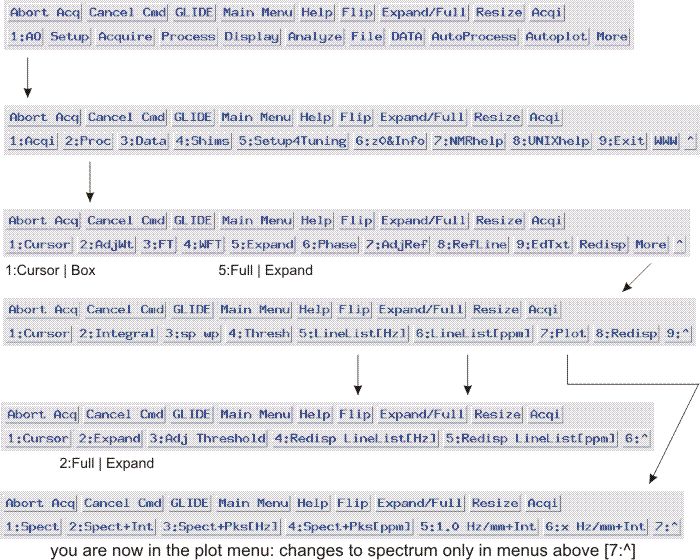
6.1.2 1D spectrum (partial processing in experiment #1)
As the intention is to also record a GCOSY, you should first only have a quick look whether the 1D spectrum is satisfactory:
1:AO -> 2:Proc -> 4:WFT (or 3:FT) then 6:Phase
If not satisfied, return to shimming, otherwise join experiment #2 by typing j2.
|
Warning: if you start
the GCOSY in experiment #1 |
|
VNMR saves data with a parameter set called procpar. This means that whenever and wherever you access the same data again, they will look exactly as you saved them. It is therefore advisable to adjust the spectrum in a way that is useful for future use before saving it on disk (-> 7.1). |
|
Figure 6.2: Partial
view of AO 1D Processing menu buttons |
6.1.3 2D GCOSY (acquisition in experiment #2)
Join experiment #2 by typing j2:
system requests and actions |
operator input |
1:AO -> 1:Acqi -> 2:C6D6 7.15 -> 2:GCOSY |
|
| What is the molecular weight? | 372 |
| How many mg of the compound? | 18 |
| Sample concentration is 70 mM | |
| Based on concentration and spectrometer sensitivity, number of transients (nt) and experimental time are calculated for a GCOSY | |
| Total acquisition time is 9 minutes | |
| Do you want to proceed [y] or [n]? | y |
| turns the spinner off, reads in the solvent- and spectrometer-specific parameter set, starts the acquisition | |
EXPERIMENT STARTED |
return to experiment #1 to process 1D! |
9 minutes later: |
|
waits for input (see 6.1.5) |
|
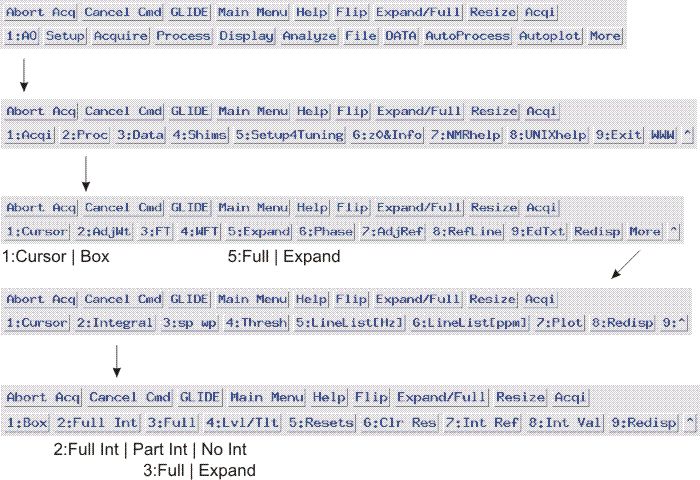
6.1.4 1D spectrum (full processing in experiment #1)
Return to experiment #1 by typing j1.
|
Figure 6.3: AO 1D Processing menu buttons |
|
Figure 6.4: AO
Processing menu buttons (integral) |
IMPORTANT: read chapter 7.1 (saving data) |
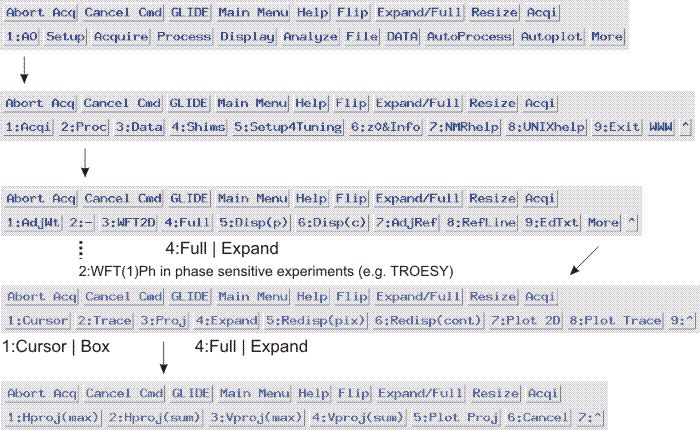
6.1.5 2D GCOSY (full processing in experiment #2)
Return to experiment #2 by typing j2.
system requests and actions |
operator input |
1:AO -> 2:Proc -> 3:WFT2D |
|
| Does weighting of the data and Fourier Transformation (FT): a mathematical process to calculate frequencies from time-domain FID | |
| FT can take between 2 and 20 seconds, then 2D spectrum is displayed with scales and text, referencing will be okay in supported solvents provided you made no changes to the acquisition parameters | Choose spectral section you desire with
left/right mouse buttons and Expand/Full button, adjust vertical display with middle mouse
button; when satisfied with the result save spectrum or plot it out with |
|
IMPORTANT: read chapter 7.1 (saving data) |
|
|
Figure 6.5: AO 2D Processing menu buttons |