|
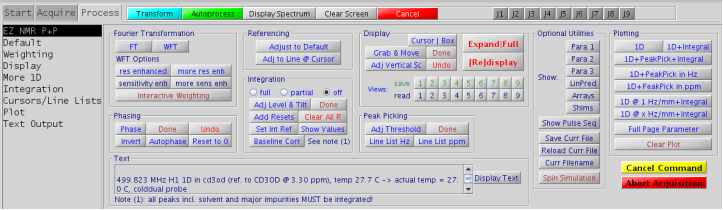
Ultimately all acquired data will need to be processed to turn the raw data (FID) into an NMR spectrum. The same philosophies that lead to the creation of the EZNMR S+A panel also lead to the creation of the EZ NMR P+P panel. There are two dynamic panels for processing 1D and 2D data sets.
Experiments can be processed while an acquisition is active. Data is sent from the console to the spectrometer host computer for processing when a block is complete (1D and 2D) and/or when an increment is complete (2D only). What follows below is applicable for an experiment that is running or has completed. |
|
|
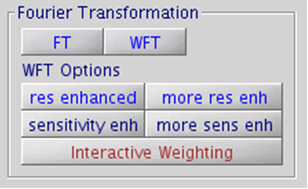
select from:
- plain FT (best for integrations)
- WFT (apply default window/weighting/apodization function)
- two levels of resolution enhancement
- two levels of sensitivity enhancement
- adjust window functions interactively
|
|
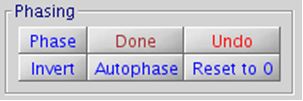
- Use the Phase button and click on Done when finished. Use other buttons as needed.
- Parameters rp and lp should be reasonable:
360 > rp,lp > -360
- Reset to zero if needed and start again
|
|
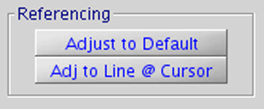
- Put cursor on any desired peak and assign a reference chemical shift or use default referencing
|
|
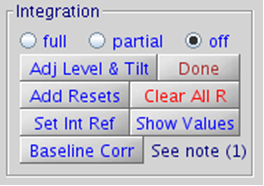
- start with full or partial
- adjust Level and Tilt of integral if needed, finish with Done button
- set Integral Resets with left clicks (right click: undo last set point)
- clear all resets if needed
- put cursor on desired integral region and set integral reference
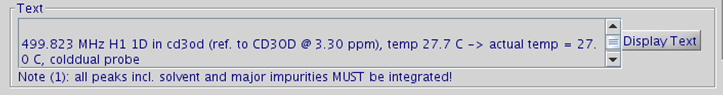
- Baseline correction: all peaks including solvent and major impurities MUST be integrated.
|
|
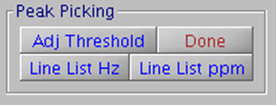
- adjust Threshold for peak pick, finish with Done button
- display peaks in Hz or ppm
- plotting has its own selection of Hz vs. ppm
|
|
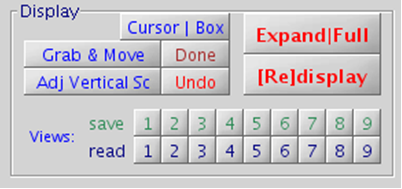
- Grab and Move: move the spectrum with the left mouse button, must be finished with Done
- vertical scale adjusts so largest peak fits; can be undone
- up to 9 individual views can be saved and retrieved
|
Text can be added, modified, deleted directly in the text box shown below:
|
|
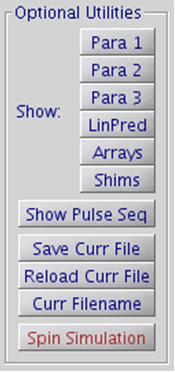
- parameters can be displayed in a separate window (equivalent to the dg, dg2, dg1, dglp, da, and dgs commands)
- Save/Reload for previously saved data only, NOT FOR INITIAL SAVING OF DATA (see 7.1)
- the current filename can be shown
- Spin Simulation can be entered here which leads to a new window
|
|
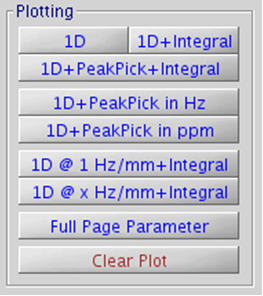
- Select from a variety of the plotting styles. All include a scale in ppm and text.
|
|
|
|
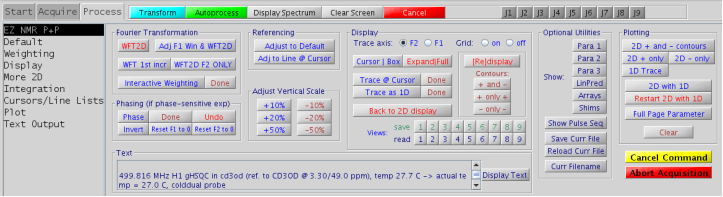
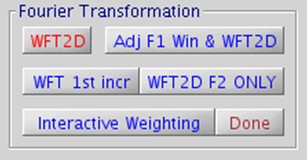
- WFT2D: process spectrum in both dimensions (F2 and F1)
- Adj F1 Win & WFT2D: use if experiment is still running; F1 window function will be adjusted dynamically
- WFT 1st incr: use for some phase sensitive expts. (i.e TROESY), process and then phase 1st increment
|
|
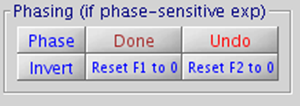
- For phase-sensitive expt’s such as TROESY and GHSQC.
- Phase 1st increment
- Phase both F1 and F2 dimensions of 2D map
- Parameters rp, lp, rp1, and lp1 should be reasonable:
-360 > rp,lp > 360
-360 > rp1,lp1 > 360
- Click on Done when finished and use other buttons as needed.
|
|
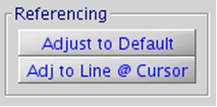
- Put cursor on desired peak and assign reference chemical shift (F2 and F1) or use Default referencing
|
|
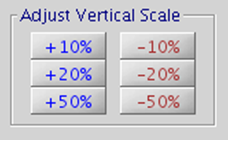
- Increase and decrease vertical scale by step size indicated.
|
|
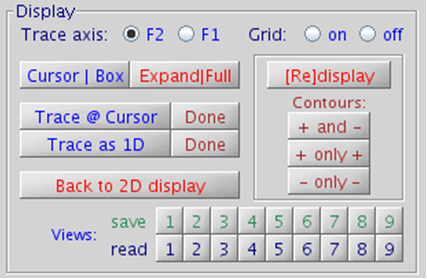
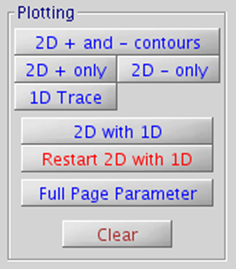
- select display with or without grid
- default axis (F2) normally does not need changing; F2 and F1 radio buttons result in 90o rotation of spectrum
- contours can be displayed:
- positive and negative (+ and -)
- positive only (+ only +)
- negative only (- only -)
- Trace @ Cursor: 1D trace at the top of the 2D
- Trace as 1D: selected trace as 1D without the 2D
- up to 9 individual views can be saved and retrieved
|
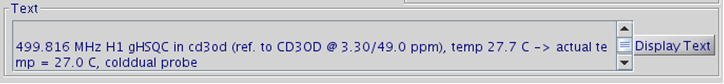
Text can be added, modified, deleted directly in the text box shown below:
|
|
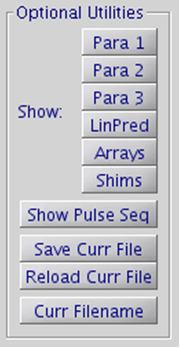
- parameters can be displayed in a separate window (equivalent to the dg, dg2, dg1, dglp, da, and dgs commands)
- Save/Reload for previously saved data only, NOT FOR INITIAL SAVING OF DATA (see section 7.1)
- the current filename can be shown
|
|
- Select from any of the plotting styles as desired. All include scales in ppm and text.
|
|
| Top of Page Table of Contents Previous Section Next Section |