|
|
FAQ 99-09.1 WFT vs. FT: what is the difference? |
Department of Chemistry,
University of Alberta December
1999
NMR News 99-09
News and tips from the NMR support group for users of the Varian NMR systems in the
Department
Editor: Albin.Otter@ualberta.ca
There are no fixed publishing dates for this newsletter; its appearance solely depends on whether there is a need to present information to the users of the spectrometers or not.
Other content of this NMR News is no longer meaningful and has been removed April 2010.
Contents
|
|
|
FAQ 99-09.1 WFT vs. FT: what is
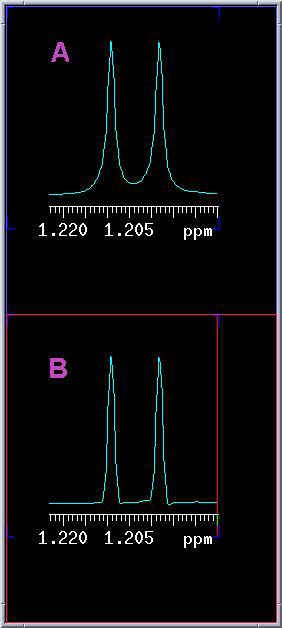
the difference? NMR peaks have natural line shapes known as Lorentzian which is the result of interactions between the individual nuclei. Example A depicts a typical Lorentzian shape doublet of a methyl group attached to a CHRR’ group after using the FT button or the ft command. The width and intensity of the lines depend on the shimming of the magnet, but even in a perfectly shimmed magnet the lines are not just "straight sticks". How wide they are, depends, aside from shimming, on the size of the molecule, the nature and viscosity of the solvent and the temperature. In simplified terms: the larger the molecule, the broader the lines because larger molecules tumble more slowly in solution. Although the natural line width is an inherent property of a dissolved compound in a given solvent and at a given field (stronger fields make the lines wider not narrower!), the actual appearance of the line can be changed over a very large range by so-called apodization or weighting functions. WFT does exactly that: it is simply a multiplication of the Free Induction Decay (FID) by a mathematical function prior to Fourier Transformation. On the other hand, when using theFT button or typing ft on the command line, the lines are left unchanged, i.e. Lorentzian (A). This (ft only) is the recommended way for integrals. The WFT button or typing wft, multiplies the FID by a Gaussian function which slightly reduces the signal-to-noise ratio but makes the lines sharper, hence it is known as resolution enhancement, and creates lines of Gaussian shape (spectrum B). It is easy to find out what the line widths are: place the cursor on a line of interest and type dres. This will return the digital resolution ( NMR News 99-08) and also the line width in Hz: 1.2 in A, 1.0 in B.
|
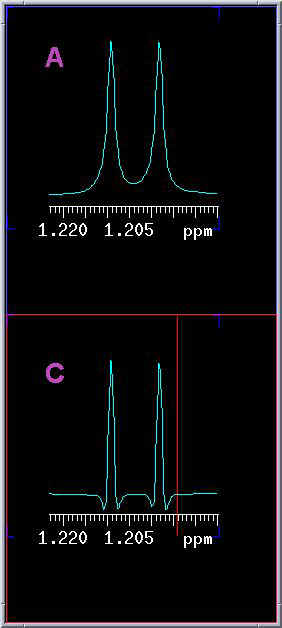 |
The weighting function can be changed over a wide range, completely interactively with the result being visible immediately (examples). The default values chosen in EZ NMR are nothing more than values that work well most of the time but not always (this is typical for anything called ‘default’!). The best is to try it out and see the effects (use wti on the command line) and change the parameters gf and gfs with the mouse. It is important to realize that higher resolution (sharp lines) comes always at the price of lower signal-to-noise and vice versa. It is not possible to enhance both at the same time and the chosen default function is a compromise between the two extremes. With strong resolution enhancement, the signals can create some negative "wings" (example C, line width 0.7 Hz). This is of no real consequence other than indicating that the spectrum has been resolution-enhanced. The benefit is that through sharper lines smaller differences in line positions can be resolved and consequently more coupling constants can be extracted. For those interested in the more mathematical
aspect. Obviously, with good shimming T2* approaches T2. |