Department of Chemistry, University
of Alberta
February 1999
NMR News 99-02
News and tips for users of the Varian NMR systems in the Department.
Editor: Albin.Otter@ualberta.ca
http://nmr.chem.ualberta.ca
There are no fixed publishing dates for this newsletter; its appearance solely depends on whether there is a need to present information to the users of the spectrometers or not.
Other
content of this NMR News is no longer meaningful and has been removed April 2010.Contents
|
|
FAQ 99-02.1 when to phase and when not to phase spectra? |
FAQ 99-02.1 when
to phase and when not to phase spectra?
In general, NMR spectra are either phase-sensitive, in which case
they need to be phased correctly for a good result, or
absolute value in which case
phasing is neither necessary nor possible. An overview of the available techniques in
the
EZ-NMR system with regard to phase sensitivity:
absolute value - no phasing |
phase-sensitive - phasing required |
homonuclear 2D: GCOSY, GTOCSY |
H1: 1D, 1D-TOCSY, 1D-TROESY,
1D-NOESY |
Phasing is
typically trivial for 1D spectra, but it can be more difficult in
2D techniques, especially in cases where C13 signals
are involved because the signal-to-noise ratio in the first spectrum
might be
too low for signals to be phased adequately.
GHMQC and GHMBC provide absolute value data
and cannot be phased by design of the pulse sequence. GHSQC
by contrast
is case-sensitive and instructions on
phasing are found here. If only
correlations are required absolute value is not a problem
but if coupling constants are to
be measured it is better to record a phase-sensitive
experiments with its inherent sharper lines.
For TROESY, correct phasing is essential for success. The procedure is described here in some detail.
In EZ-NMR P+P use button WFT 1st incr
(it is located in the Fourier Transform section) which will produce a spectrum
of the
first increment in the 2D matrix, i.e. it is the FT of the first of the series of FIDs that were collected (as
indicated by ni, for
example 256). It is not uncommon that the phase of this
spectrum is quite off.
 |
|
However, this can easily be corrected. Just use the Phase button which
is in the Phasing section of EZ-NMR P+P. Use
the left mouse button to phase the spectrum until it looks like the one shown on
the right above. When done,
use the
WFT2D button to transform the entire 2D spectrum.
 first increment not phased correctly |
after correct phasing of the first increment |
 |
The difference in the quality of the spectrum is dramatic. When correctly phased, even peaks close to the diagonal can be seen clearly as shown with arrows in the expansion on the left. If phasing is desired directly on a F2 trace taken from the 2D spectrum then pmode='full' has to be entered before processing. By default pmode='partial' which saves disk space and speeds up the FT but does not allow phasing of the 2D spectrum after WFT2D. Even when using the full option, the correct phasing as described here before WFT2D is still an excellent idea. |
Phase sensitivity is a prerequisite for correct
TROESY data interpretation. All NOE/ROE-type of experiments suffer
to some extent
from undesired effects which are created through interactions via bonds rather than
through space (see also
NMR News 98-08). Phase
sensitive recording makes it possible to distinguish the two contributions. True
through-space
correlations are of opposite phase of the diagonal, whereas undesired
effects are of the same phase. This is best seen
in the colors displayed on the monitor,
i.e. diagonal peaks are by default phased positive and displayed with yellow/orange/red
colors ("warm" colors) whereas the negative levels are in blue/purple
("cold" colors). Sometimes cross peaks show a mixed
phase, that is they
have a lot of purple but also some yellow in them. This is a sign that some distortion of
the NOE through
coupling interactions is present. This is not a problem for qualitative or
semi-quantitative interpretations, but it precludes such
peaks from integration for
quantitative studies like inter-proton distance measurements.
An example (from a different data set than the one shown before) is depicted here. The mixed phase is clearly evident (blue is NOE, yellow is J-distortion). |
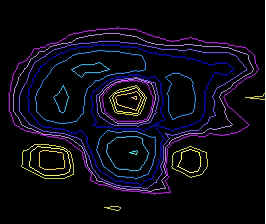 |