Department of Chemistry,
University of Alberta October
2006
NMR News 2006-05
News and tips from the NMR support group for users of the Varian NMR systems in the
Department
Editor: Albin.Otter@ualberta.ca
http://nmr.chem.ualberta.ca
There are no fixed publishing dates for this newsletter; its appearance solely depends on whether there is a need to present information to the users of the spectrometers or not.
Other content of this NMR News is no longer meaningful and has been removed May 2010.
Contents
|
|
|
|
|
|
gHSQC: another
method to obtain C13/H1 correlations The Table below provides a short comparison of the plus/minuses of both techniques:
* If the lines are broadened by couplings then gHSQC is perfectly alright. It is not so good when lines are broad due to short T2 relaxation times. In such cases it may fail altogether while the gHMQC still works. Unique to gHSQC, is the ability to
distinguish carbons by their multiplicity (APT-style). It is possible to
turn this feature off (by default it is on). If no multiplicity-distinction
is desired change the parameter mult from 2 to 0 on the command line:
mult=0 then hit the GO! button. |
|
|
|
|
|
|
|
(4) A fourth
combination (C13-coupled and mult=1) is not shown here.
|
|
|
|
|
|
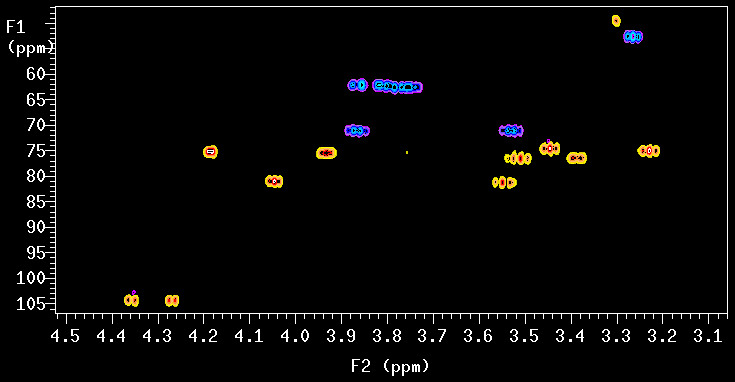
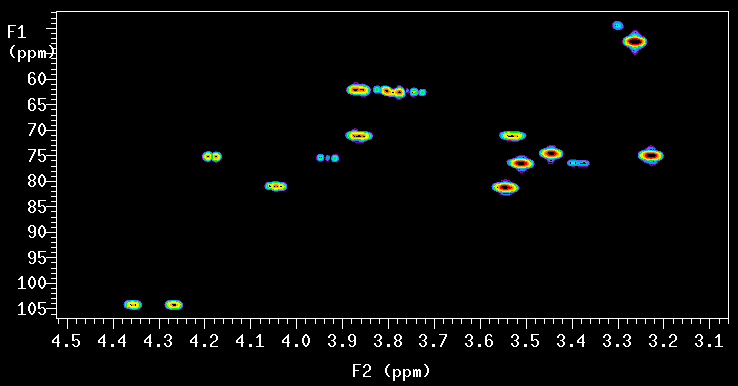
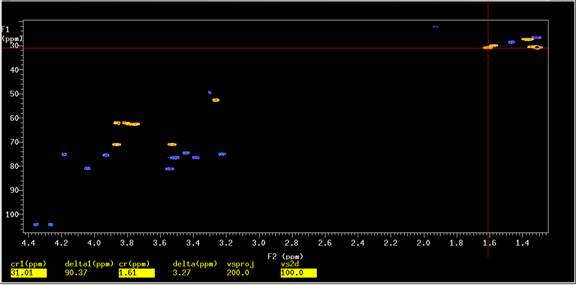
Phasing gHSQC data (instructions by Mark Miskolzie - this information is also available as a PDF document for easy printing. How to Phase a Phase-Sensitive gHSQC At first, the phasing procedures seem complicated. However, after a few times it is very straightforward and fast. These phasing instructions are applicable to all phase-sensitive 2D experiments (TROESY, NOESY, etc.). 1. Save and then load the spectrum if you have not done so already. This ensures that you can go back to the original spectrum in case something goes wrong with phasing; it also ensures that the parameter file has the correct information. 2. On the command line type prochsqc and wait for the Fourier Transformation to finish. 3. Observe the spectrum. If the spectrum has been acquired �apt style�, areas of the spectrum that contain CH3 and CH groups have similar phase (positive or negative, the choice is up to you), whereas CH2 groups have opposite phase. See Figure 1 for a well phased spectrum.
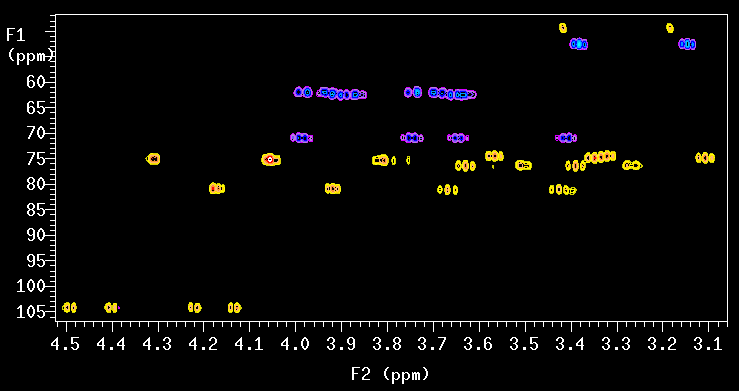
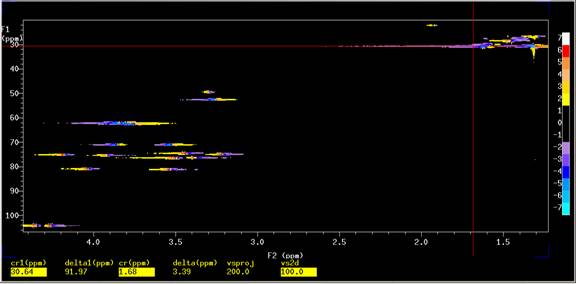
4. It is very likely that your spectrum looks like the one in Figure 2, i.e. you need to adjust the phase of the spectrum.
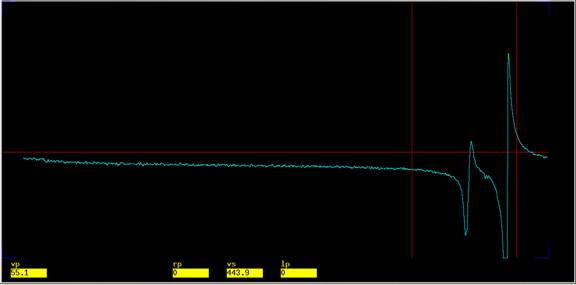
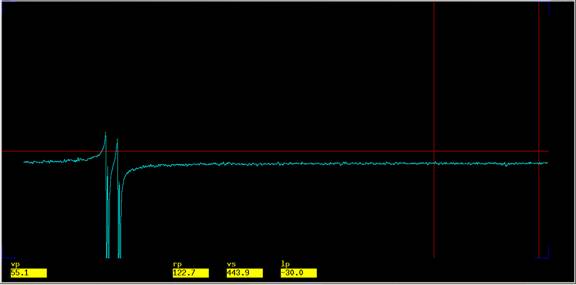
Choose an area of the spectrum, parallel to F2, through a series of correlation peaks that have a dispersive lineshape; CH3 group(s) work well for this but so do CH2 groups like the ones chosen in Figure 2; place the cursor along these correlation peaks and type ds on the VNMRJ command line to display the 1D spectrum (trace) parallel to F2 through these correlation peaks, see Figure 3.
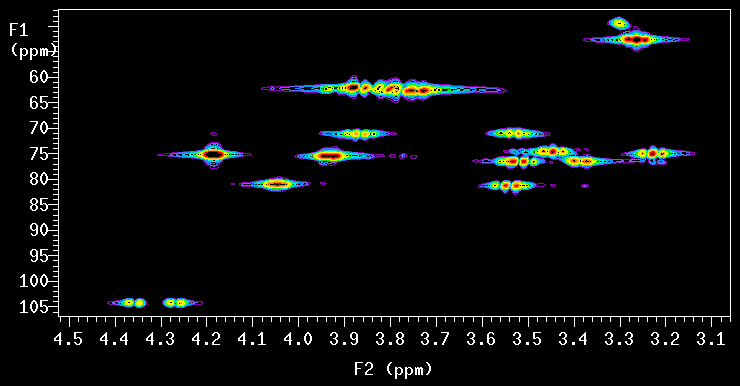
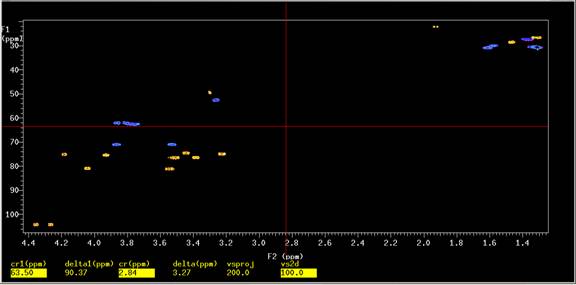
5. Phase the spectrum by clicking on the phase button and then clicking on or near the peaks of interest, Figure 3; use the left and right mouse buttons to phase the spectrum (left click and hold - course phase; right click and hold - fine phase). 6. Display the 2D spectrum by typing dconi on the VNMRJ command line. The spectrum should look similar to the example shown in Figure 4.
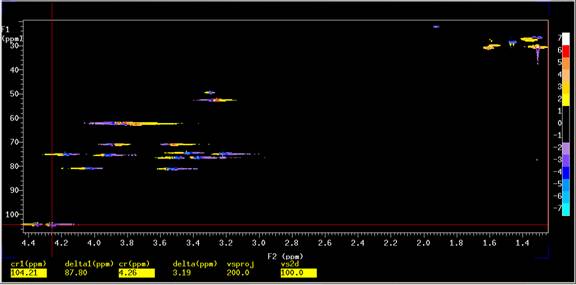
7. Choose another region of the spectrum, preferably a CH group(s), as was chosen in this example (see cursor placement in Figure 4) and type ds on the VNMR command line to display a trace through the peak(s) of interest, Figure 5. Note: the two areas that are used to phase the spectrum should be well separated, e.g. a normal alkane CH3 and an aromatic CH group (if present) would be most suitable for phasing.
Click on the phase button, move the cursor approximately to the region of the spectrum that was phased in step 5 (this region is now empty, see Figure 5), click the left mouse button and then WITHOUT CLICKING ON THE PHASE BUTTON move the cursor adjacent to or on top of the peaks of interest. Click the left mouse button once more and phase the spectrum as described in step 5. The two mouse clicks described above are performed directly after each other WITHOUT CLICKING ON THE PHASE BUTTON. This action is performed to add first order phasing to the spectrum (the parameters lp and rp change) whereas a single mouse click adds zero order phasing to the spectrum (only the parameter rp changes). Display the 2D spectrum by typing, on the VNMR command line, dconi
8. If further adjustments are needed repeat steps 4 to 7. It may take several iterations to achieve best results. 9. Phase the indirectly detected F1 (=C13) dimension. Type f1 on the VNMR command line to rotate the spectrum such that the F1 axis is parallel to the bottom of the monitor. Phase the spectrum as indicated in steps 4 to 7.
Note:
Phasing a phase-sensitive spectrum is an iterative process: adjustments on one
side of the spectrum affect other portions of the spectrum. Be prepared to
repeat steps 4-7 several times. Additional information A. Phasing parameters (rp, lp, rp1 and lp1) should be within the limits shown below (type dg1 to display values):
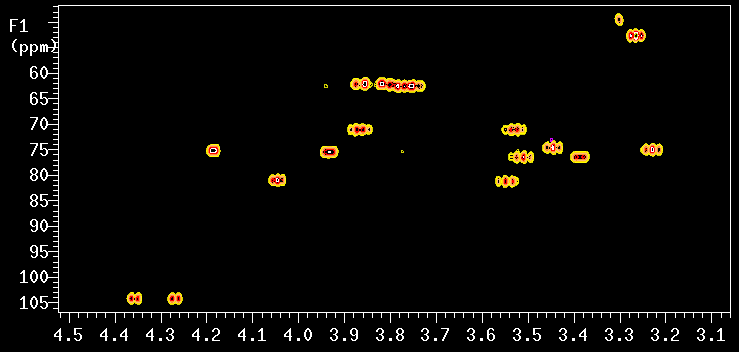
Values outside these limits may be in error; it would be best to reset the parameter(s) to zero and try again. resetph dconi (resetphase and rstph have the same effect) will reset all phase constants (F1 and F2) to zero while resetphf1 dconi (resetphasef1 and rstphf1 do the same) will reset only the F1 phase constants. Repeat steps 4 to 8 or 4 to 9 depending on what was reset. B. To invert your spectrum, type inv dconi on the VNMRJ command line. The resulting spectrum is shown in Figure 7, compare with Figure 1!
C. Resave the spectrum after phasing so that the phasing results will be present the next time you load the experiment. To resave a spectrum with the exact same filename type svf(file) on the VNMRJ command line. The command is entered exactly as typed above. |