NMR News 2011-01
News and tips for users of the Agilent NMR systems in the Department
Editor: Mark.Miskolzie@ualberta.ca http://nmr.chem.ualberta.ca
There are no fixed publishing dates for this newsletter; its appearance solely depends on whether there is a need to present information to the users of the spectrometers or not.
Contents
-
How to plot multiple spectra on a single page.
-
Table 1. A summary of display commands, macros, and parameters.
-
Table 2. A summary of plotting commands.
How to plot multiple spectra on a single page.
Users often ask the NMR Service Staff how to plot more than one spectrum on a page. The user may want to present data from a reaction or kinetic study where many NMR experiments were performed or simply want to plot expansions from a single experiment to a single page. Ultimately the data may also end up in a publication, a presentation, or in the user’s thesis.
The procedure is actually very straight forward and can be performed almost entirely from the VNMRJ command line using a combination of VNMRJ display and plotting commands, macros, and parameters. The procedure is best illustrated using an example, plotting 2 expansions from a H1 1D experiment to a single page. A full explanation of all commands, macros, and parameters used in the how to plus others can be found at the end of this document.
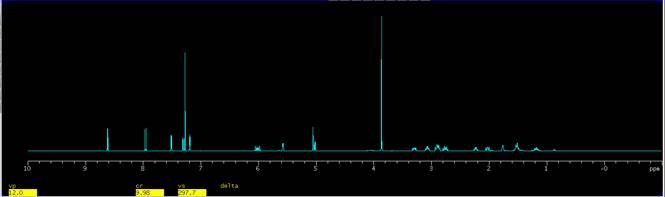
1. Load and process a spectrum. The spectrum can be any 1D data set, i.e. C13 1D, APT, P31 1D, etc. A H1 1D of a commercial reagent is used in this example.
|
Figure 1. The full spectrum of a spectrum of a commercial reagent. |
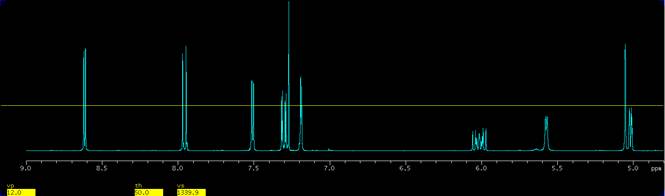
2. Display a region of the spectrum how one would like. In the present example an expansion from 9 ppm to 4.8 ppm is used, Fig. 2.
Save your view by clicking on the button save 1
|
in the display area of the EZ NMR P+P panel or by entering:
s1
on the VNMRJ command line followed by the enter key.
Saving views is advisable so that you can return to a view easily, quickly, and precisely without having to re-expand a region of the spectrum over and over again. Saving a view will also ease the plotting procedure if it needs to be repeated.
3. Adjust the region of interest so that another spectrum can be plotted on top of it. Adjustments can be made using the threshold line as a guide for consistent peak height. Enter:
th=50
on the VNMRJ command line to set the threshold to be 50 mm above the spectrum. Click on the button Adj Threshold to display the threshold line, Fig.2.
4. Adjust the spectrum so that a peak of interest reaches the threshold line. Click the middle mouse button or scroll wheel above a peak of interest on the threshold line. The height of the peak of interest will now be as tall as the threshold line, Fig. 2. Re-save your view by clicking on the button save 1 or by entering s1 on the VNMRJ command line.
|
Figure 2. Expansion from 9 to 4.8 ppm, setting the threshold to 50 mm and adjusting a peak of interest to the threshold line. |
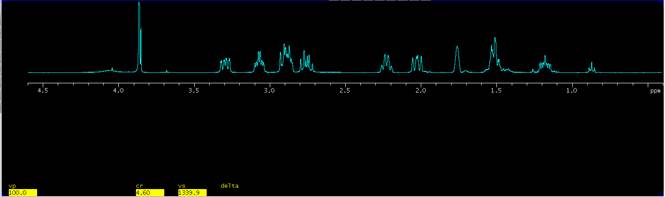
5. Display the full spectrum by clicking on the button Expand|Full in the EZ NMR P+P panel and expand a different region of interest. In the present example a region from 4.6 ppm to 0.4 ppm is selected, Fig. 3.
6. Place the spectrum in the upper portion of the graphics display window by entering
vp=100
on the VNMRJ command line followed by enter key (a vertical position of 12 (vp=12) is the default). This leaves room for plotting a spectrum below this expansion. The results are shown in Fig.3.
|
Figure 3. Expansion from 4.6 to 0.4 ppm and placing the expansion at a vertical position of 100 mm (vp=100) from the bottom of the graphics window. |
Save your view, click on the button save 2
|
in the EZ NMR P+P panel or by entering
s2
on the VNMRJ command line.
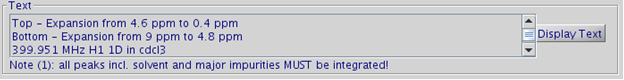
7. If desired, enter meaningful text in the Text box in the EZ NMR P+P panel.
|
Figure 4. Meaningful text indicating what will be printed. |
8. Set a value for the parameter cutoff. Enter:
cutoff=50
on the VNMRJ command line. Setting a value for the parameter cutoff will ensure that any peaks greater than 50 mm above and below the baseline of the spectrum are truncated and as a result no peaks from either expansion will enter into the other expansion. To turn this off when needed enter cutoff='n' on the VNMRJ command line.
9. Plot the data. In the current view enter:
pl pscale mmpltext
on the VNMRJ command line, followed by the enter key. If desired print intergral values, pir, and/or print a peak pick, ppf.
10. Retrieve the first view, click on the button read 1
|
in the display area of the EZ NMR P+P panel or by entering:
r1
on the VNMRJ command line, and then plot the data by entering:
pl pscale
and if desired print intergral values, pir, and/or print a peak pick, ppf, by entering these commands on the VNMRJ command line. Finally enter
aopage
to spool the information to the printer. The plot should look like the following.
|
Figure 5. The final plot. |
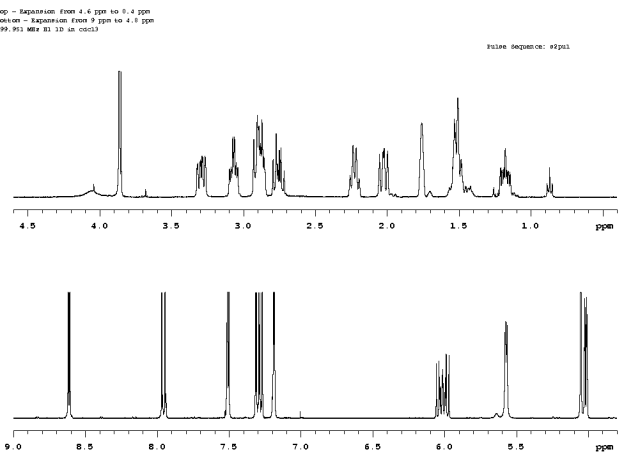
The key to the above procedure is that nothing is ever spooled to the printer until the aopage command is issued. More elaborate plots can be made with a little experimentation and knowledge of display commands, macros, and parameters, see Tables 1 and 2 below. All that is need is a little practice and imagination! The above procedure will also work when creating postscript files.
Plotting from more than one experiment can also be achieved. The procedure is performed in a similar manner as described above however data are loaded in different experiments, expansions are made, views are saved in these experiments, and plotting commands are performed in each experiment. Once again, the final plot is created when the aopage command is issued.
Table 1. A summary of display commands, macros, and parameters.
| Command Macro Parameter |
Definition |
ds |
A command to display a spectrum. This command can be used as a screen refresh for 1D data sets. |
dpf |
A command to display peak frequencies at the peak. |
dpft |
An in house macro display peak frequencies at the top of the page. |
dpir |
A command to display integral values. |
f |
A command to display the full spectrum. Usefull after an expansion has been made. |
ff |
A macro that combines the action of the f and full commands. Displays the full spectrum full screen |
full |
The spectrum will be displayed across the full graphics window. Useful when wc has been changed. A command. |
getv |
An in house macro that can be used to move expansions from one experiment to another. For example, entering: getv(1) on the VNMRJ command line will transfer the currently viewed expansion from experiment 1 and apply it to the current working experiment, i.e. experiment 2, provided that the spectra are similar, a H1 1D has been loaded in both experiments 1 and 2. |
killplot |
A macro that will delete any incomplete/intermediate plots. Very useful when one is aware that a mistake has been made before the page command is issued. |
left |
Displays the spectrum on the left hand side of the graphics window. Parameters wc and sc are changed. A command. |
right |
Displays the spectrum on the right hand side of the spectral window. Parameters wc and sc are changed. A command. |
center |
Displays the spectrum in the centre of the spectral window. Parameters wc and sc are changed. A command. |
| r1 to r9 | Retrieve a previously saved view/expansion. r1 will retrieve the view/expansion saved as s1; r2 will retrieve the view/expansion saved as s2; etc. |
| s1 to s9 | To save a view or expansion to be recalled later, enter s1. There are 9 views available to the user, s1, s2, s3, etc. |
sc |
Start of chart, how far from the right hand edge of the graphics screen a spectrum is displayed. A mm scale from 0 to 250 mm. Adjustments are made by setting sc to a value, i.e. sc=100. A parameter. |
setv |
An in house macro to set an expansion exactly as desired. For example, entering: setv(5,1 ) |
th |
Threshold value, a mm scale from 0 to 1e9 mm. Threshold is usually used as the cut off for peak picks, peaks below the threshold line are not picked. th in this tutorial is used as a guide to set peak heights/cutoff limits for plotting. |
vp |
Vertical position, the vertical position that a spectrum is displayed in the graphics screen. A mm scale from 0 to 180 mm. The default is 12 for most 1D data sets. Adjustments are made by setting vp to a value, i.e. vp=50. A parameter. |
vs |
Vertical scale, a unit of measurement for the height of displayed peaks. A parameter. |
wc |
Width of chart, how wide a spectrum is displayed. A mm scale from 5 to 250 mm. Adjustments are made by setting wc to a value, i.e. wc=75. A parameter. |
Table 2. A summary of plotting commands.
Command |
Definition |
pl |
Plot a1D spectrum. |
pscale |
Plot the scale for the spectrum. |
pltext |
Plot text associated with the experiment. |
mmpltext |
An in house macro for VNMRJ 4.2A to plot text associated with the experiment and acquisition parameters. |
pap |
Plot all acquisition parameters. Not to be used with pltext or ppa. |
ppa |
Print basic acquisition information. Not to be used with pltext or pap. A macro. |
pir |
Plot integral values. |
pll |
Plot a line list as a table of peaks that have been picked. |
ppf |
Plot peak frequencies at the peak. |
ppft |
An in house macro to plot peak frequencies at the top of the page. |
page |
Spool the print information to the printer. An argument can be added to page as a filename when creating postscript files, i.e. page('filename.ps'). |
aopage |
An in house macro that will spool the print information to the printer or to a picture file automatically. Files are created in the current working directory and named automatically based on the original FID name. |