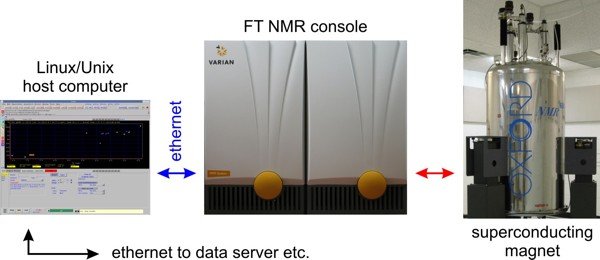
Each spectrometer consists of three main components:
Figure 4.1: The main components of an NMR spectrometer
The entire system is controlled nearly 100% from the host computer. The only exceptions are: inserting/removing the sample, tuning the probe (if necessary) depending on the sample (solvent, concentration, salt content etc.).
Input into and control of the system is via keyboard or a three-button mouse:
Figure 4.2: Three-button mouse
The 300 and 600 MHz systems are designated as proton NMR systems with indirect detection of heteronuclei. All others can observe heteronuclei directly. A comparison of available probes and feasible experiments is given in the Table below:
spectrometers
and probes |
i300 |
i|m400 asw |
ibd5 sw |
u500 |
i600 |
| proton 1D | Y | Y | Y | Y | Y |
| GCOSY, GTOCSY | Y | Y | Y | Y | Y |
| NOESY, ROESY, TROESY | Y | Y | (Y) | Y | Y | Y |
| 1D versions of 2D with soft pulses | N | Y | N | Y | Y | Y |
| gHMQC, gHMBC, gHSQC | Y | Y | Y | Y | Y |
| 3D techniques | N | N | Y | N | Y |
| 13C: 1D, APT, DEPT | N | Y | Y | Y | N |
| 31P 1D, 15N 1D | N/N | Y/N|Y/N | Y/Y | Y/Y | N/N |
| HETCOR (13C, 31P) | N | Y | Y | Y | Y | N |
| temperature control * | Y | Y | Y | Y | Y |
* spectrometer and probe dependent
4.2 Sensitivity and spectral dispersion
Spectral dispersion is proportional to the field strength hence a 500 is 66% better than a 300 while a 600 is twice as good as a 300. The probability for spectral overlap in a two-dimensional experiment decreases significantly with increasing field strength:
300: 1.0 400: 0.56 500: 0.36 600: 0.25
The sensitivity for protons and resulting experimental times or sample concentration, respectively, to reach the same signal-to-noise ratio is compared below:
spectrometers
and probes |
i300 |
i400 m400 asw |
u500 |
ibd5 |
i600 |
170:1 |
250:1 150:1 |
400:1 |
900:1 |
1200:1 |
|
experimental time to reach s/n at a given sample concentration [minutes] |
75 |
34 96 |
4 |
2.5 |
1.5 |
sample concentration required to reach s/n in a given time [mM] |
50 |
23 64 |
2.5 |
1.8 |
1 |
1H sweep width in Hz for 10 ppm |
3000 |
4000 | 5000 |
5000 |
6000 |